
In today’s article, we’ll look at the details you need to pay attention to when building your data platform, as well as examples of transition projects we’ve worked with.
Returning to the framework for building a data platform for automated reporting, let’s take a closer look at a few points from last week’s article:
PHASE 1. Analyze & Plan
Gather Data
- Examine all the reporting in use today and categorize it by business process function.
- Link the strategic goals of the organization to the reporting – assess the gap between where you are and where you want to be.
- Identify key metrics
Identify and prioritize data
- Prioritize and categorize reports by type: operational, management, predictive, regulatory
- Define data artifacts, reporting architecture, and archiving policies
Data migration and data model creation
- Develop a new data model, data cataloging system, and plan
- Define how data will be transferred from source to data platform
- Develop a logical model for data storage, processing, and consumption
Data Visualization and Analysis
- Choose a visualization tool or develop your own
- Define access rights and visibility for users or user groups
- Develop new reports and data showcases for self-service analysis capabilities
PHASE 2: Reporting Platform
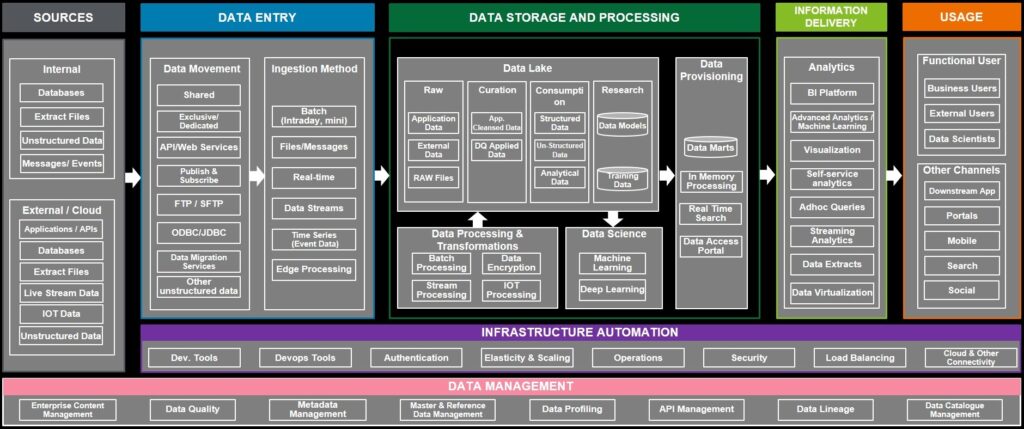
For the reporting platform to work effectively, you need to consider the diversity of data sources:
- The first is home-grown sources, or data collected directly from within the organization. This could be sales data, financial data, operational data, etc.
- Second, applications as data sources. Today’s organizations increasingly use a variety of applications to collect and process information. This data can also be integrated into a reporting platform for general analysis.
- The third is third-party data. This can be data from suppliers, partners, or third-party services. Integrating this data into the reporting platform can provide a more complete picture of the business and its environment.
The reporting platform should be able to download data from all these sources and ensure quality processing and storage of the information. Important aspects of working with data are its history, cleanliness, and preparation for further analysis.
To present the data to the user, the reporting platform should be able to create a variety of reports and visualizations. Business Intelligence (BI) plays an important role in analyzing data and identifying key trends.
Data platform migration project examples
European Insurance Company
- Objective
A large European insurance company decided to implement a new data system due to the requirements of IAS 17. The goal of the project is to create a single and reliable version of data for all branches of the company and to enable long-term storage of information. During the planning phase, it was decided that the new data platform should not only provide reporting, but also support solutions such as Customer 360 and FinOps principles.
- Solution
To solve the problem, the decision was made to implement a cloud-based data warehouse. The team designed the data architecture, created a data model and reusable components that could be easily connected and used with minimal customization. Emphasis was placed on using a template approach so that artifacts could be reused. Dashboards and reports were developed based on the data model and storage structure.
- Outcome
By using a template approach, most of the components of the new data platform could be shared across the organization with minimal effort. Implementing a common data platform provided a unified view of data, unlocking the potential of existing information and allowing the company to achieve deeper reporting and use AI. Applying DevOps principles enabled the automation of the entire data process deployment process.
European Energy Company
- Task
The client, a large European energy service provider, was faced with data silos due to the implementation of new ERP and CRM systems. The goal was to unify disparate customer data to improve analytics. Prior to implementing the solution, reporting was inconsistent and inefficient. Revenue was at risk due to incorrect calculations of customer value, churn, and third-party data.
- Solution
The team created a new data structure, enriched it with sales information, and implemented a master partner concept for a complete view of the customer. An order funnel was developed to increase lead conversion.
- Outcome
A single data point was created to enable reporting, analysis, and marketing campaign selection. A single view of the customer allowed them to be identified across contracts, ensuring continuity of key sales and marketing action planning, such as churn prediction.
European manufacturing company
- Task
A client specializing in the development of thermal imaging devices and digital optics was experiencing long lead times for financial, operational and regulatory reporting. The CFO was tasked with accelerating the reporting process, which previously took 2-3 weeks after the end of the month. The client’s goal was to develop an automated solution to collect, cleanse, and generate monthly reports.
- Solution
To achieve this goal, the team used the Data Platform Design methodology for analysis and planning. The client’s current processes and systems were analyzed to propose an improved architectural solution for the new data platform.
- Outcome
The result of the work was a roadmap of phased tasks. The client was provided with a comparison of the different architectural options for the new data platform, as well as information on infrastructure costs and staff training. The client received clear recommendations for the next steps in calculating the costs of the pilot phase.
Russian Spa Hotel
- Task
The client is a high-end spa hotel in the Russian Federation. It was found that delays in decision making and availability of reports were affecting the quality of service. It was necessary to eliminate redundant requirements by improving data handling.
- Solution
It was decided to create a data warehouse that would become the central hub for reporting and a single point of truth. An open source technology stack was chosen to reduce the cost of the project. The main users of the new solution were the marketing and sales departments.
Conclusion
Data platforms provide organizations with the ability to efficiently process, analyze, and communicate information to make timely decisions based on relevant data. Automating the collection, processing, and reporting processes reduces time spent on routine tasks, improves data accuracy, and enhances the quality of analysis. As a result, the use of data platforms helps to increase business efficiency, ensure that data is received on time, and maintain the company’s competitiveness in the marketplace.